Guidelines for Writing a Thesis (or any other technical writing)
Technical writing is not the same as other forms of writing. There are certain expectations from the audience ( readership) that must be met. However, we often do not learn proper writing until after we have written many papers (and some people never learn!). Consequently, the literature is full of poorly written papers. And because most of us learn to write by reading papers, it seems things are getting worse.
This guide is supposed to help you write a better thesis; it is based on the things that I correct often in my students’ reports and papers, as well as in manuscripts I review or handle as an editor for Pattern Recognition Letters. Though I specifically refer to theses, just about everything here also applies to papers and other technical writing. Please read this whole page before starting to write!
Many choices need to be made when writing a thesis: what spelling to use, which symbols and abbreviations to use, what referencing system to use, how many levels of sectioning to use, etc. The actual choice is often less important than being consistent about the choice: avoid mixing British and American spelling, for example.
Under some points, I explain how to get things done properly using LaTeX. Recommended packages are available on most installations by default. If you use another system (i.e. MS Word or LibreOffice) to produce your thesis, I would ask you to reconsider and switch to LaTeX! If you are stubborn and want to keep using a system not designed for technical writing, you will have to find out by yourself how to replicate the proper formatting.
After you have read this page, make sure to also read The English Language: things that people in Sweden often do wrong (and other common mistakes), which will help you avoid common mistakes in word usage, grammar and punctuation.
Cris (somewhere in 2014).
The Abstract
The abstract is the most important piece of your thesis. People will see your title, decide based on that whether it is worth their time to read the abstract, and based on that decide whether it is worth their time to download/print/read the rest of your document. It is said that, for every person that reads a paper, anywhere between ten and five hundred will have read the abstract. This is why you need to put a lot of effort into writing a good abstract.
An abstract is a concise summary of a thesis, not a movie teaser or trailer. It needs to explain what the thesis is about, what methods are used, and what the results and conclusions are. For a very convincing argument concerning abstracts, read Scrutiny of the Abstract. For more help, read How (not) to write an abstract.
Remember that the abstract should stand on its own, so do not include references to your bibliography list. Write out any citation you find necessary to include.
The Main Text
Your thesis should explain exactly what you did, how, why, and what the results were. Try to think about your colleague students: would they be able to repeat your experiments (or implement your algorithm) based solely on the description you give? If not, something is wrong.
In general, you need to find a good middle ground in between being too informal (do not use slang!) and being too dry and boring. This is a well-written paper that does a good job of criticising the boring tone of a lot of science writing you see nowadays. For example, passive sentences (sentences without a subject) tend to make text boring. For this reason, passive sentences are avoided like the plague in non-technical writing. Strangely enough, in technical writing the opposite is true: any sentence where the subject is the author is written in passive form to avoid the pronoun I. This does not only make boring text, it may also lead to awkward sentences or even unhelpful sentences: “This method was considered to be insufficiently accurate.” (By whom?) In other cases, inanimate objects are blamed for the actions of the author: “This thesis investigates…” (A thesis cannot do anything! It just lies there, with letters all over its pages!) In other cases, the editorial we is used, even if there is only one author.
The passive form can be useful in technical writing, as long as it is not too frequent and does not disturb the meaning. But there really is no reason to avoid personal pronouns where they are relevant. To me, a sentence like “The author thanks his colleagues for support.” feels ridiculous. Furthermore, I do not see any reason to avoid using the pronoun I.
Do not use acronyms in the title of your thesis, and always define an acronym the first time you use it: “Optical character recognition (OCR) is really cool. We use OCR in this work.”
Sectioning
In biology (as well as some other disciplines), a paper is usually divided into: introduction, material and methods, results, discussion, and conclusion. In computer science and similar fields, this division is not commonly followed, though some authors prefer it. In this field, the interesting part of the work is often a new algorithm, and the results are just to support the proposed methods. In this case, it is advantageous to deviate from the classical division, and make a section or chapter specifically dedicated to explaining the method you are proposing. It is perfectly fine to have more chapters, and use different titles in your thesis. The most important thing to take into account when choosing a division into chapters and sections is to keep related things together, and to put things into a logical order, so that reading linearly from beginning to end is possible.
You can divide up your chapters in any way you see fit. But make sure that you do not have a subsection x.1 if there is no subsection x.2. It is also good practice to have text in between any two section headings (that is, write something under 2.1 before starting 2.1.1).
The Introduction
The introduction should provide the reader with enough knowledge to read the rest of the thesis, but also should explain the reason your thesis exists: why did you do this research? Depending on who you assume will read your thesis, you will need to give more or less detail about the existing literature in the field, introduce the theory and methodology that you depend on, etc. This can be done in the introductory chapter or in a second chapter specifically dedicated to prior work. In any case, you need to find out who your readership is, and make assumptions about what they already know and what they do not. Do not write things that would be obvious to your readership. The first of the Three Sins of Authors in Computer Science and Math gives a good overview of how not to write an introduction.
It is also increasingly common to add a paragraph at the end of the introduction explaining how the document is organised. That is, the paragraph lists the number and name of all the sections. This is nothing more than a table of contents, and is always useless. In your thesis you should have a real table of contents before the main text. In a paper, which is typically much shorter, you do not need a table of contents at all. Saying that “In the conclusion section we conclude the paper” is more than useless, it is embarrassing. However, what you can do is give references ( chapter numbers) throughout the introduction, when you discuss the various aspects of your thesis. For example, you might have a paragraph saying that you developed a new algorithm; you can add “(Chapter 5)” to this paragraph to help the interested reader skip ahead to the bits he/she might be interested in. More on this you can find as the second sin in Three Sins of Authors in Computer Science and Math.
The Conclusion
A thesis typically ends with a chapter called Conclusions. Too often, the conclusions chapter is confused with an abstract, and instead of discussing the conclusions of the work, it just summarises the paper. There is no point of yet another summary, the abstract fills that role. The funny thing is that the conclusions chapter is often a better abstract than the abstract itself! On more than one occasion I have recommended to a student to delete the abstract text, and move the text from the conclusions chapter to the abstract.
The conclusions are the result of the work: what have we learnt from it? This is a place to put the results in a larger context, to discuss their meaning. It is perfectly fine to also discuss possible future work, for example. The third sin of Three Sins of Authors in Computer Science and Math gives some more detail about what not to do in this section.
Equations
Equations written by computer science students tend to give me some grief. They typically look more like computer code than mathematical expressions. The two most common errors are the use of the asterisk to represent multiplication, and the choice of variable identifiers. I expand upon these two things below. Besides correctly writing mathematical expressions, make sure that the equation is part of the sentence. For example, you could write the relationship between the perimeter p and the radius r of a circle as
Note that there is no colon before the equation, and the period indicating the end of the sentence comes after the equation. Make sure also that all variables are typeset in italics, and that they are defined in the text.
The asterisk (∗) is not a standard symbol in mathematics, and can mean anything. For example, it is sometimes used to
represent the convolution operator. Thus, if you use it, you have to specify what it means. But do not ever use if for
multiplication! In a mathematical expression, two variables or constants next to each other, separated by a thin space,
are multiplied together, as in the example above. Do not write π∗r, π⋅r, or π×r. The dot product (⋅) is the
product between to vectors, and yields a scalar. Since it can be applied to one-dimensional vectors, it is in principle
correct to use the dot product to represent the multiplication of scalars. But you should use this only if you need to
emphasise the multiplication operation, or when you multiply two numbers, e.g. 4.23⋅106 vs. 4.23 106.
The cross product (×) is a product between two vectors in three-dimensional space, yielding another
three-dimensional vector. Do not use the cross product symbol between two scalars. The exception is when you give the
size of a matrix: n × m. This is by analogy to, e.g., the size of a rectangle: 10 cm × 5 cm. Note that this use of
the × symbol does not happen in mathematical expressions, but in plain text. In LaTeX, write $\times$ for the cross
product, and $\cdot$ for the dot product.
In mathematical expressions, a variable is represented by a single letter, typeset in italics. A computer program
typically uses longer names for variables. However, when you give such a longer name to an equation typesetting program,
the program will think it the product of a bunch of variables, rather than a single variable. For example, if you
write $error = \sum x_i-y_i$ in LaTeX, what you get is . To correctly typeset
this, you would have to use the command $\mathrm{error}$ or $\mathit{error}$, depending on whether you want “error”
to be written in italics or upright. However, more correct is to use a single-character variable, and define in the text
what the letter represents.
Subscripts can have various meanings. If it is a variable (e.g. xi), it should be typeset in italics, as all
variables (in LaTeX, simply type $x_i$). If it is a name (e.g. xred), it should be typeset upright (in LaTeX,
type $x_\textrm{red}$).
Units
Write 10 m, never 10m or 10 m. Make sure that the space in between the number and its units is non-breaking:
in LaTeX you would type 10~m. Some common errors with units:
- Remember that kilo is written with a lower-case k: 10 km.
- For a byte use the capital B: 100 kB.
- For a bit, do not use the lowercase b, write out all three letters: 100 Mbit/s.
- 1 kB = 1000 B, a kilobyte. 1 KiB = 1024 B, a kibibyte.
For an extensive check list for typesetting units see SI Unit rules and style conventions. To typeset units in LaTeX, the siunitx package is highly recommended.
Numerals
Within a sentence, small numbers (integers) should be spelled out. Some people say numbers one through nine should be spelled out. Some other people think ten should be spelled out also. And yet another group of people think all numbers you can spell with a single word, e.g. twenty, should be spelled out. In any case, do not write “1”!
When giving numerical results, round them to however many digits are significant. That is, if you were to repeat the experiment, which digits do you expect to stay the same? Any digits that would change from run to run are meaningless, and should not be reported. For example, you compute the running time of an algorithm, and get 5.34563424 s. It is highly likely that anything past the millisecond is noise. It is even quite likely that the milliseconds are noise also. You should probably report 5.35 s.
Conversely, when trailing zeros are significant, do type them! For example, 5.30 s is not the same as 5.3 s.
If you have more than four digits in a row, separate them with a thin (non-breaking) space: 69 305.29 s
(LaTeX: \thinspace). Do not use a comma or a dot, as both of these are used to separate decimals in different
countries, and can be confusing. Remember you are writing for an international audience!
To indicate a range, use an n-dash: 10–30 mm (LaTeX: 10--30~mm). Note that the following symbols are all different,
do not mix them up:
- minus symbol: − (LaTeX:
$-$) - hyphen: - (LaTeX:
-) - n-dash: – (LaTeX:
--) - m-dash: — (LaTeX:
---)
Page Numbering
The first page in the PDF file should be page number 1. Number consecutively from there. Avoid numbering the front matter separately (you see this most often with roman numerals; the LaTeX “book” document class does this). The reason is that it is inconvenient when the page number shown on the page does not match the page number shown by the PDF viewer. In LaTeX, use the “report” or “article” document class for theses and papers, respectively.
Figures
Figures are the most visible elements in your thesis: people will leaf through it, stopping at figures and trying to find out what they mean. Thus, it is important that the figures are clear, concise, and stand more or less alone.
Plotting Graphs
You can use whatever program you like to plot your graphs. However, it is highly recommended to not use the default settings, no matter what software you use! The resulting plots usually do not translate well to a printed page. In particular, make sure that all the text in the plot (axis labels, legends) are sufficiently large to be comfortably read (i.e. never less than 9 pt, but preferably the same size as the main text). Furthermore, there typically ar e too many numbers written along the axes, which is not necessary and gives a crowded feel.
Make sure that each axis has a label, indicating what is set along that axis, and in what units. Leave the title off: the figure caption fulfils that role, making the title redundant.
Think well about what form of graph you want to use. The form should match the type of data, and highlight the story you want to tell with the data. Make sure that you summarise your data so that this story is clear: plotting all data points just because they took effort to obtain is not a good reason, often it is better to show averages, trends, etc. If you need to show relative differences between data points, use a logarithmic axis.
Think also well about what colours you will use, and if you need to use different line types or markers to differentiate data points. The simpler the graph, the better. I often find it advantageous to plot all lines in black, and add text directly on or next to the line to explain what each line represents. Of course, this only works when the lines do not cross too much. When choosing colours, remember that about 8% of men have trouble differentiating between red and green (these genetic defects are linked to the X chromosome, and therefore is much less common among women).
The legend is typically drawn to indicate what each line or marker represents. Legends are quite disturbing, you can try one of these options to reduce this disturbance:
- Write a label directly next to each line.
- Draw the legend outside the plot box.
- Write the information you would put into the legend in the figure caption instead.
Note that, if you have several subfigures, and they all have the same legend, you only need to draw the legend once. Please avoid redundancy as much as possible!
Save your figure as a vector drawing (preferably as a PDF file if you use the pdflatex command to build your thesis).
Try to avoid pasting screen shots of your graphs, or saving them as bitmap files. If you have no other choice than to
use a bitmap file, make sure that it uses 300 DPI (at the final size in your report). If you have more than 300 DPI,
your report file will become needlessly large; if you have less, the graph will look ugly and text might be difficult
to read. Make sure that the bitmaps are not compressed with a lossy format (even PDF distillers will use JPEG compression
on larger bitmaps unless you specify you do not want this). Lossy compression on graphs introduces very strong artefacts.
In the course Scientific Data Presentation I give a more in-depth overview of plotting graphs.
Figure Captions
The caption of a figure should explain what is in the figure. The first (short) sentence usually functions as a title, and (depending on house style) is sometimes typeset differently than the rest of the caption. Make sure that the reader does not need to search through the text to figure out what the figure represents. Writing “see text for details” is not helpful at all. If the details are too complex for the caption, indicate where in the text the details can be found: “see Section 3.2.5 for details”. At the end of the caption you can describe graphical elements you used (e.g. “Scale bar = 100 μm”).
Referencing Figures
Figures should be numbered sequentially, but also referenced sequentially in the text. Put each figure close to where it
is referenced for the first time. Try to keep figures at the top or bottom of the page (LaTeX: \begin{figure}[tb]).
In LaTeX, to reference a figure write Figure~\ref{label}. The non-breaking space is to avoid the number being by
itself on a new line.
Tables
The rules for figure captions and referencing are also valid for tables. Tables are typically numbered separately from figures. In general, use a table if you need to give exact values, use a graph if you need to show relationships between the values. For example, one often sees comparisons of various algorithms in tabular form, with best values highlighted. It is much more meaningful to do such a comparison in graphical format, where it is clear not only which algorithm is superior, but also how large the difference is. My working hypothesis is that people show results in tabular form so that it is not so obvious that the differences are insignificant. For very few numbers (two or three), just write them directly in the text; it is a waste of space to make a table of a graph for that.
Organisation of a Table
Avoid repetitions in tables. Units common to all cells of a column should be given in the column’s head, typically between brackets. If all numbers are, e.g., multiples of a thousand, change the units of measurement to avoid repeating the zeros.
It is important that the numbers in each column can easily be compared. This requires all numbers being aligned on the decimal period (even if it is implied). If numbers are not aligned this way, it is difficult to distinguish orders of magnitude. In LaTeX, the siunitx package provides a column type, S, that aligns columns on the decimal period. Alternatively, use the dcolumn package.
Typesetting Tables
Tables are clearest and easiest to read if they do not have any vertical rules, and only have horizontal rules at the top and bottom, and between the head and body (see below for an example). With so few rules, there is no need for bold text, colours, or other gimmicks to separate the table head and body. If you use LaTeX, use the booktabs package.
Even if you do not use LaTeX, read the first three pages of the booktabs documentation, which explain how to correctly format a table.
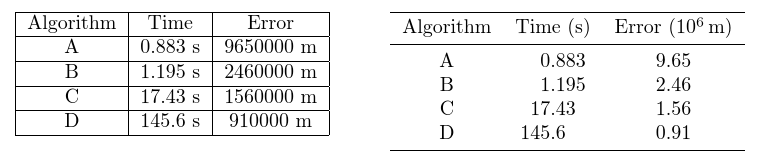
Left: Example of a standard table in LaTeX, with some of the things you can do wrong when making a table. Right: The correct way of presenting the same data.
Citations and Bibliography
You can choose whatever citation format you prefer. The two main contenders are:
- author–year: “(Name, 1999)”
- numbered: “[5]“
These are simply different ways to reference an entry in the bibliography. Each citation style requires a different formatting of the bibliography, more on that below. Always use software to build your bibliography and keep track of citations in your text. For LaTeX users, use BibTeX; for MS Word users, use EndNote. If you really want to do it manually, use the author–year style citation, because it is very hard to renumber references manually if you have to add or delete a reference.
Citations
Citations are not a noun, do not use them as such. Anything between brackets is by definition not part of the sentence.
For example, “This was presented in [1].” is not a complete sentence. Instead, write “This was presented by Author
et al. [1].” In LaTeX, this can be accomplished easily using the
natbib package, which is included in every LaTeX installation.
When using natbib, instead of using the command \cite{}, use \pcite{} or \tcite{} instead (for parenthetical
cite and textual cite, respectively). Use the “numbers” package option to get numbered citations.
Please read the natbib reference sheet.
Multiple citations should be included in the same pair of brackets: [1,2,3], not [1],[2],[3]. Using natbib, put
the various labels in the same \pcite{} or \tcite{} command, separated by commas. Do not forget to precede any
numeric reference with a non-breaking space, so that the line does not break right before the number, leaving it
dangling by itself on a new line. This applies to references to the bibliography as well as references to figures,
chapters, etc., but does not apply for citations in the author–year style. For example:
See Figure~\ref{fig1}.As proven two decades ago~\citep{Author1995},…
When referring to three or more authors, write the first name followed by “et al.” (note the period!). Et al. is short for the Latin phrase et alii, which means and others.
Bibliography
Be consistent in the bibliography list, and include all the required information to find the cited material. If using the author–year style citations, format the bibliography such that the author names and year of publication come first:
- Name, A.; Other, B.; and Boss, C. (1999) The Paper Title, Journal Name 1(1):1–10.
If you use numbered citations, make sure the number comes first; the year can now be at the end:
- [5] Name, A.; Other, B.; and Boss, C. The Paper Title, Journal Name 1(1):1–10, 1999.
Sort your bibliography alphabetically. This makes it easiest to find references in the author–year format, and also makes it easiest to search the bibliography for specific authors or papers. The only advantage of sorting the bibliography according to the order of citation is if you have very long lists of citations in the same pair of brackets: “[1–10]” is more pleasant than “[10,2,13,8,23,41,25,27,28,9]“.
It is always better to not cite on-line content. Wikipedia is a great resource, but it should point you to actual published material that you should read and cite. If you really have to cite on-line content, include the date on which you retrieved the content. This is because on-line content is not fixed, and it is possible (even likely!) for it to change in between you reading it and your audience reading it.
In BibTeX, write author = {Last Name, First Name} or author = {First Name {Last Name}} for authors with compound
last names. For example, author = {Cris L. Luengo Hendriks} is interpreted as C.L.L. Hendriks, which is not my
name; author = {Luengo Hendriks, Cris L.} is correctly interpreted as C.L Luengo Hendriks. In the title field, use
brackets around names and acronyms that should preserve their case: title = {The {Fourier} Transform on the {GPU}}.